
Google Core Web Vitals (Web Core Vitals) has been hot for a few years now and has become the next generation of Web performance experience and quality metrics. Basically blogs that talk about WordPress speed optimization mention it. What is Core Web Vitals and why is it important for WordPress? How to optimize them?
This post is all going to cover all the information about Core Web Vitals and how to optimize them on your WordPress site. We'll tell you what they are, how to optimize them to improve dyno scores and user experience, and even improve Google search rankings.
What are Core Web Vitals?
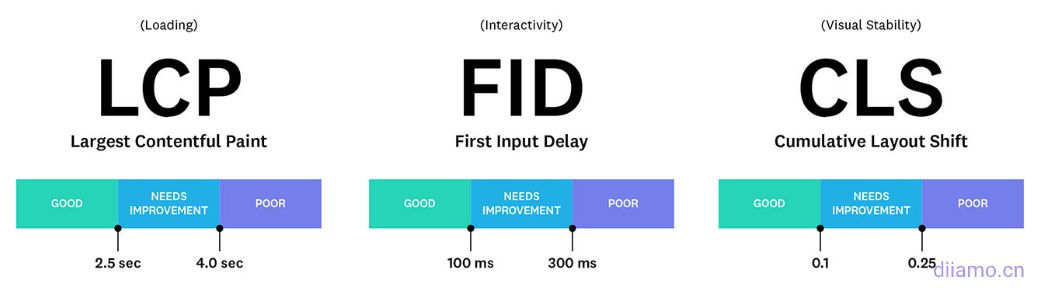
Core Web Vitals is a program launched by Google to measure the quality rating of websites in order to measure and improve the web user experience. It is characterized byGoogle speed test3 scoring items inside: Largest Contentful Paint (Maximum content drawn),First Input Delay (first input delay), Cumulative Layout Shift (Cumulative Layout Offset).
Instead of simply measuring total page load time, Core Web Vitals focuses on the performance of a website and items related to user experience, which simply means how quickly a user can start interacting with a page. It is a better measure of a site's performance and user experience than total load time, and is currently the key metric for speed testing and optimization.
Now you should probably understand what Core Web Vitals is, below we will explain in the simplest way what Core Web Vitals means and how to optimize it to help you get more traffic to your website.
What is Largest Contentful Paint (LCP)?
Largest Contentful Paint (LCP)Refers to the maximum content drawing time, which reports the point in time when the rendering of the largest image or block of text (the most meaningful content) visible in the viewing area is complete, based on when the page first started loadingrelative time(not the actual load time).
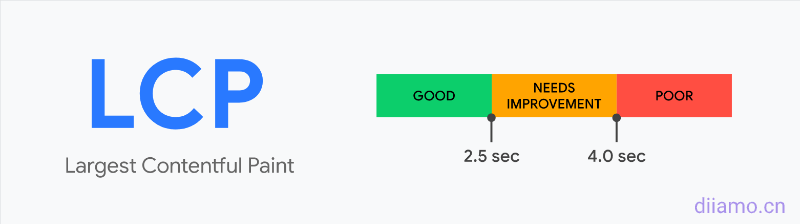
Below ↓ The green area is the LCP content.
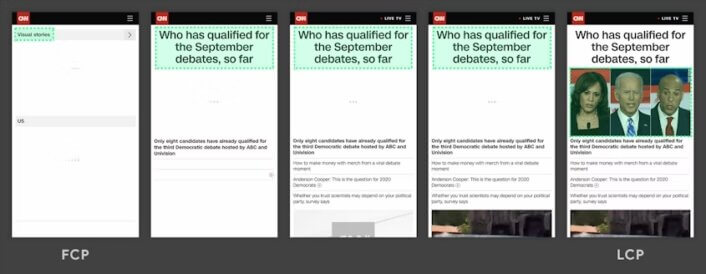
LCP is an important user-centered metric for measuring perceived loading speed, as the metric marks a point in the page loading timeline when the main content of the page is essentially loaded, and a snappy LCP helps to reassure the user that the page is working.
According to Shopify.LCP is the most important performance metric affecting conversion and bounce rates. According to Google Tech Report data from November 2023, LCP has the lowest pass rate of all core Web metrics.
The LCP content of a page may not be fixed, but dynamically changing, and the LCP content may be different for different loading time periods. In most cases, LCP content is the largest content at the top of each page of the website, which generally refers to the Banner image on the home page, the featured image at the top of the page, and the top text area.
The LCP does not currently calculate all elements as this would make the metric very complex, it now only looks at the following elements:
<img> elemental
elements within elements
What is a good LCP time? See the Google thresholds below:
- (of an unmarried couple) be close - Less than or equal to 2.5 seconds.
- Need for improvement -- Less than or equal to 4.0 seconds.
- differ from --over 4.0 seconds.
LCP is ↓ affected by TTFB, resource loading delay, resource loading time, and element rendering delay.
| LCP Subpart | Improved methodology (influencing factors) | weighting of impact |
|---|---|---|
| TTFB | Mainly hosting and CDN + full page caching | ~40% |
| Resource loading delays | Exclude first-screen content from optimization, resource tips | <10% |
| Resource loading time | Reduce image/CSS/JS size, critical CSS, CDN, cache expiration | ~40% |
| Element rendering delay | Render blocking CSS/JS, JS file size, font display optional | <10% |
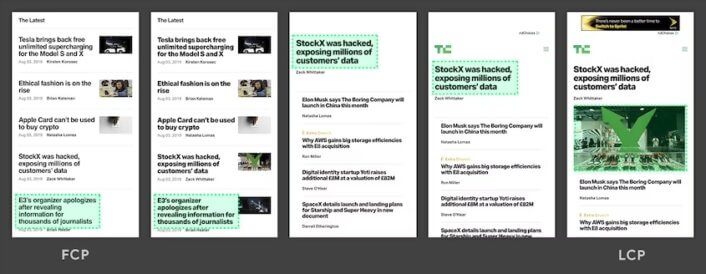
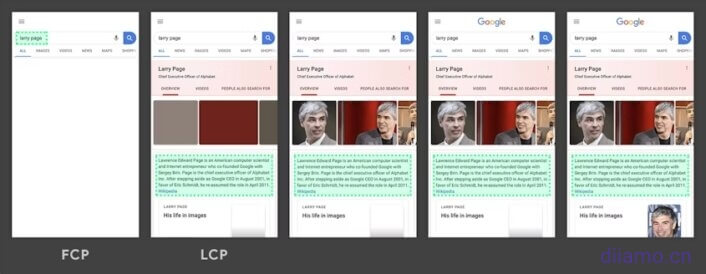
Side note: LCP is very similar to First Contentful Paint (FCP), another metric included in PageSpeed Insights. The key difference is that LCP loads the "principal"Measurements are taken when the first screen is content. fcp specializes in "first"The time it takes for content to load - perhaps a startup screen or a loading indicator - is a less relevant UX element.
LCP is affected by FCP and will always take longer to load than FCP.
What is Cumulative Layout Shift (CLS)?
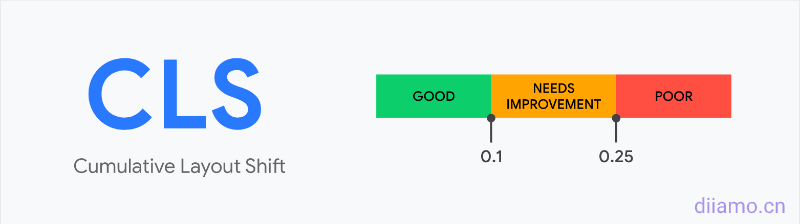
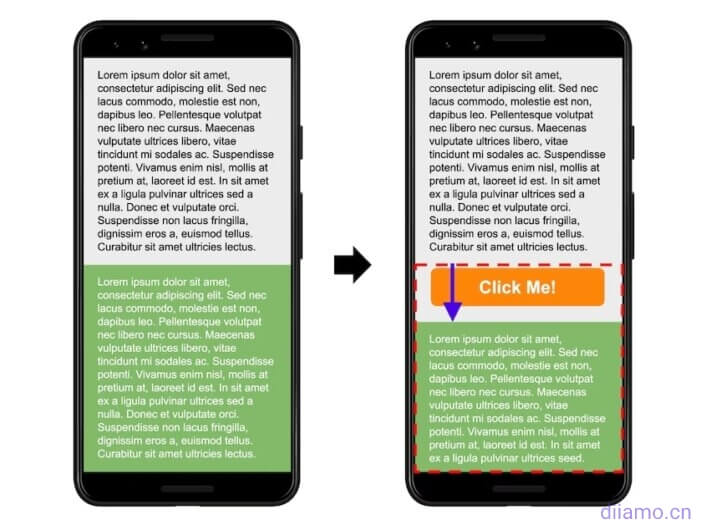
Cumulative Layout Shift (CLS)Finger Cumulative LayoutmisalignmentThe CLS score is simply a measure of whether or not the content of a page has moved during the loading process. The more it moves, the higher the score (poor), and the lowest score (excellent). CLS scores equal to or lower than 0.1 are required to achieve "good".
The page loads when the following red box text block at the beginning of the display at the top, as the code loads the rendering text block moves to the distance from the top of the 25% position ↓, this is the layout offset.
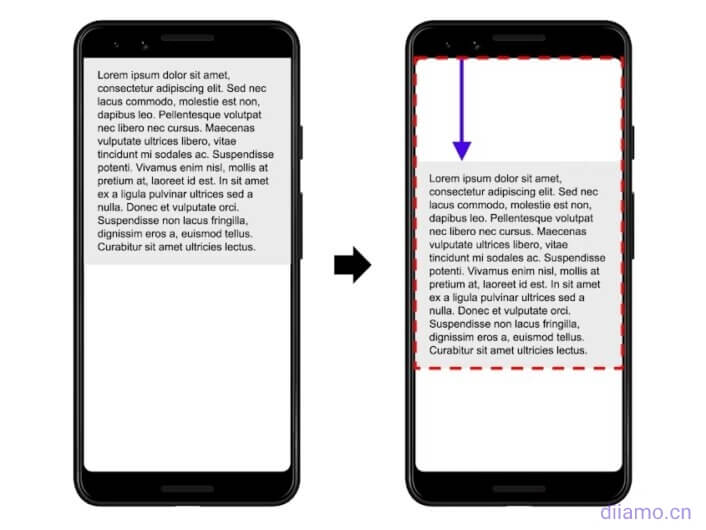
When the page loaded at the beginning of the following picture red box text block position from the top 50%, then the orange button shows up red box text block position down, which is also the layout offset.
Cumulative Layout Shift (CLS) is the measurement of theVisual Stabilityis an important user-centered metric because it helps quantify how often users experience unexpected layout shifts, and a lower CLS helps ensure that a page is pleasing to the eye and improves the user experience.
The cumulative layout changes are very annoying to users and how they will have a bad experience. What is a good CLS score? See the Google thresholds below:
- favorable - Less than or equal to 0.1.
- Need for improvement -- Less than or equal to 0.25.
- differ from -- more than 0.25.
What is First Input Delay (FID)?
First Input Delay (FID) refers to the first input delay, i.e., the time between the first time a visitor interacts with a web page and the time when the browser begins to process (and not finish processing) the interaction, which can be interpreted as the time from the time you order at a restaurant → to the time when the chef receives the order and begins to make it. JS is often the main factor affecting FID.
FID only measures the "latency" of event processing; FID does not measure the time it takes to process the event itself, nor does it measure the time it takes for the browser to update the user interface after running the event handler. Some pages may have no interactive elements and therefore have no FID impact.
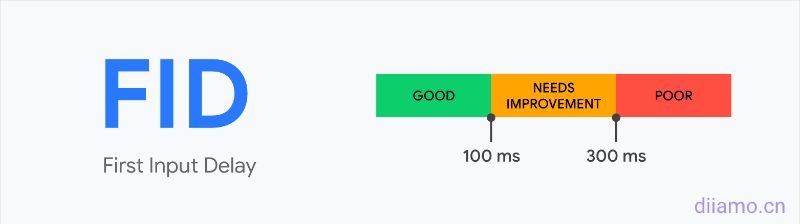
First Input Delay is not the same as Time to Interactive (TTI), although they are very similar. TTI measures the time it takes for a page to become fully interactive, which can be thought of as the time from when you place your order at a restaurant → until your meal is prepared and delivered to you.
First Input Delay (FID) is the measurement ofLoad responsivenessis an important user-centered metric because it quantifies the user's experience when attempting to interact with an unresponsive page, and a low FID helps reassure users that the page is valid.
What is a good CLS time? See the Google thresholds below:
- favorable - Less than or equal to 100 milliseconds
- Need for improvement -- Less than or equal to 300 milliseconds
- differ from -More than 300 milliseconds.
Core Web Vitals Impacts SEO Ranking Results
In June 2021, Google began using Core Web Vitals as one of the ranking factors, and these metrics may affect your SEO performance.Core Web Vitals will be part of the new page experience signals.
Core Web Vitals will affect mobile and desktop search results, and your site will need to meet a specific minimum Core Web Vitality score to appear at the top of search results in popular stories and in headlines.
More importantly, there seems to be a need forMeet all Core Web Vitals metricsIt's the only way to improve your rankings.Non-indexed pagess Core Web Vitals score is also important.
In short: to get better SEO results, you must improve your website's Core Web Vital score.
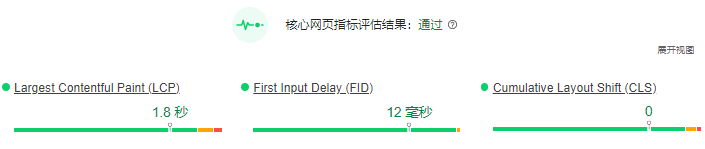
How to Use PageSpeed Insights to Detect Website Core Web Vitals
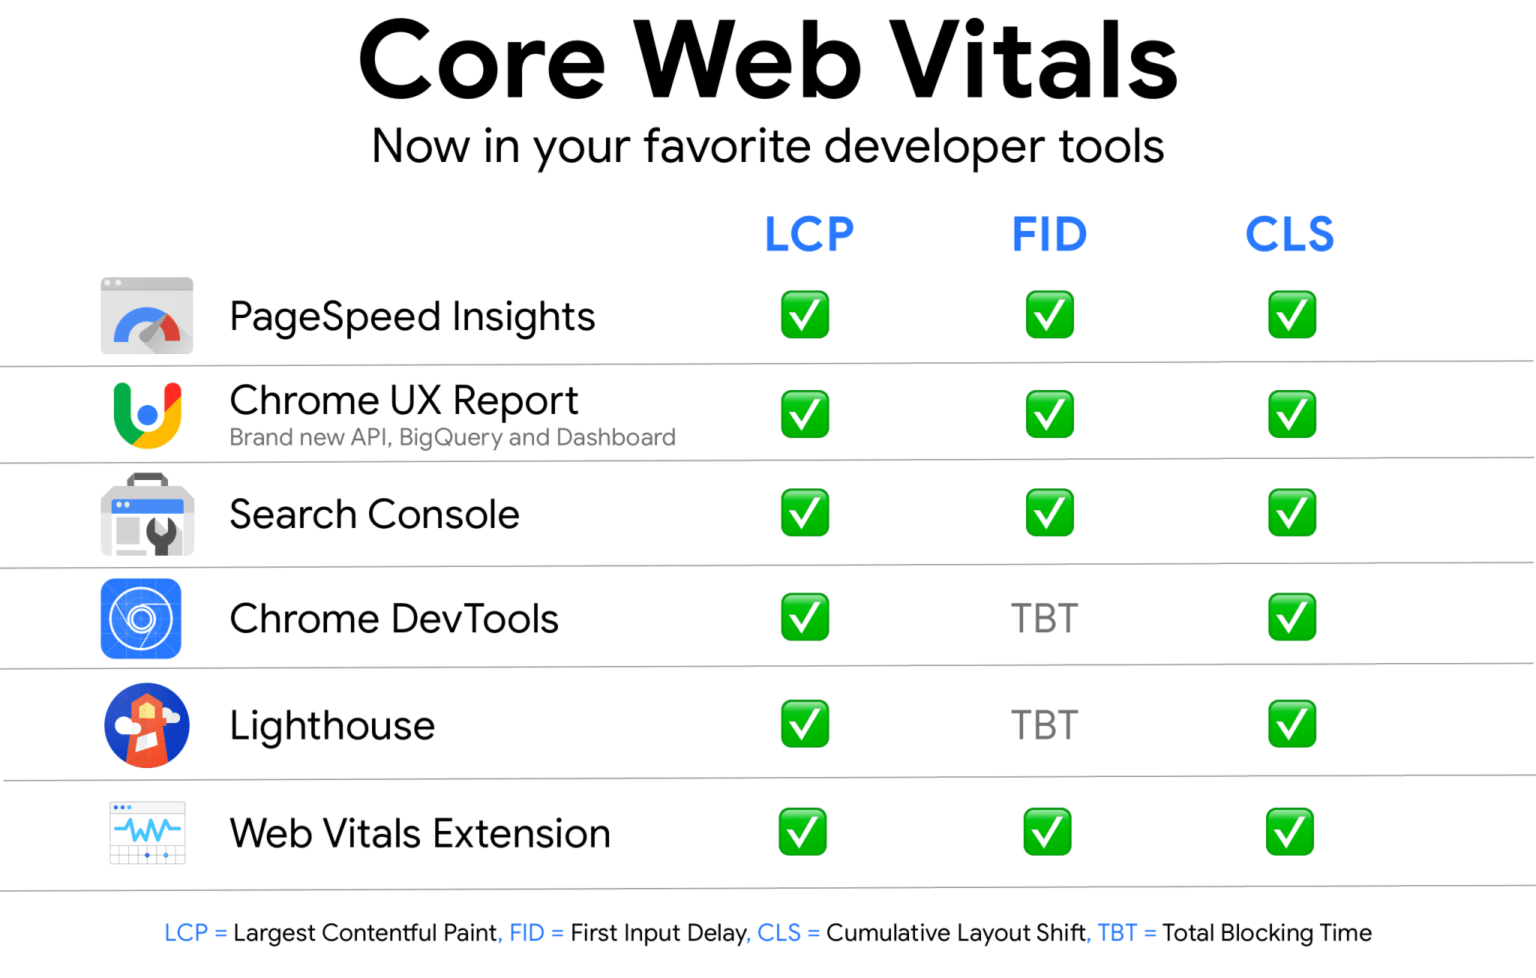
Below is a list of tools that can check Core Web Vitals scores, such as PageSpeed Insights, Chrome DevTools, CrUX Report, and more. We recommend usingPageSpeed InsightsTest Core Web Vitals, because it is the official Google speed test tool results are more reliable, and the test results have given optimization recommendations.
Detection Methods:
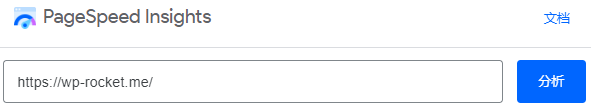
Open the wall-flipping software, then open the official website of PageSpeed Insights Google testing tool (https://pagespeed.web.dev/), enter the URL of the page to be detected and click "Analyze" to start detecting the website. Each page needs to be analyzed.
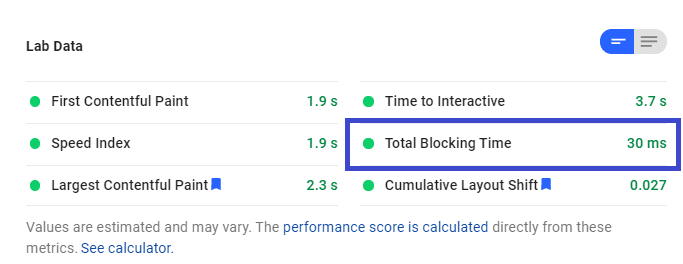
LCP and CLS scores are displayed in the test results.

FID (First Input Delay) is based on actual user data and is therefore not shown in the test scores. The FID time can only be seen in the Field Data section when enough data has been collected for the CrUX report. In the test results, theTotal Blocking Time (TBT) In lieu of FID, FID scores can be improved simply by improving TBT.
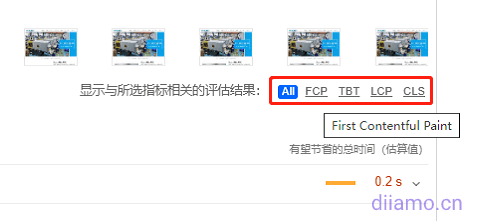
Below the picture of the test results ↓ Click on the appropriate content to view the content affecting FCP, TBT, LCP, CLS (optimization recommendations).
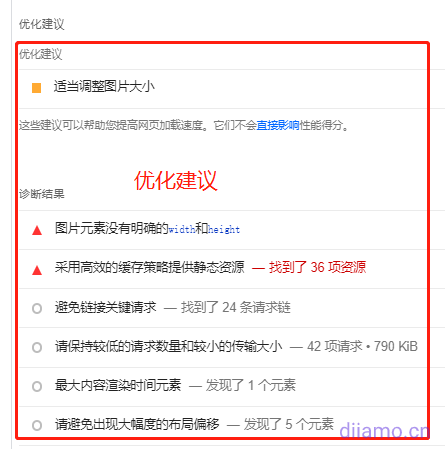
Optimization Recommendation ↓.
Caveats:
- Core Web Vitals scores may vary slightly between Field and Lab Data. This is normal, depending on how the data is collected;
- Running tests may not have any field dataThis is because there is not enough real user data available. It will not affect your Core Web Vitals because PageSpeed Insights takes into account lab data for page speed scores;
- Always check mobile and desktop results. Your Core Web Vitals metrics will vary between the two. Keep in mind that mobile scores are the most relevant andMost challengingThe
How to View the Entire Site Core Web Vitals Report in Search Console
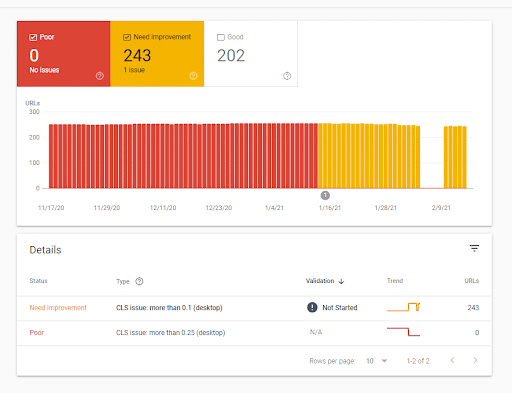
PageSpeed Insights detects individual page Core Web Vitals reports, if you want to diagnose the entire site, you can use the Core Web Vitals report in Google Search Console (Google Webmaster Tools).
The report is based on aggregated real user data from CrUX, so it takes a while for the site to go live before the data can be viewed.The Core Web Vitals report is perfect for identifying groups of pages that need attention, whether they are desktop or mobile.

When you open the report, you will find a Details tab that groups URL performance by several criteria:
- Status (poor or needs improvement)
- Type of indicator (e.g., CLS issue: greater than 0.25 (desktop))
- URL groups (lists of URLs with similar performance).
After fixing the URLs that need improvement, you can also click on the "Validate" column and continue with the "Validate Fix" option. Keep in mind that the validation process can take up to two weeks - please be patient!
How to Improve Your Website Core Web Vitals Score
Core Web Vitals score is closely related to the speed of the website, which involves all aspects of the website.The optimization method of Core Web Vitals is the same as the speed optimization method, as long as the website speed is fast enough Core Web Vitals score is naturally good. So focus on optimizing the speed, try to optimize the mobile and computer scores to more than 95 points.
We wrote theUltimate WordPress Website Speed Optimization TutorialsThe "Theory and Practice", the "Theory and Practice", and the "Theory and Practice".Advanced Advanced WordPress Optimization TutorialHelp you to fully optimize the speed of the site in depth, from optimization ideas to methods to tools to teach, so that your site pages open in seconds!
After following the tutorial to optimize your website, use thePageSpeed InsightsTest the speed of the main page, according to the optimization of the improvement of checking and perfecting can be.

